
How to Look Up Dallas County Jail Population Data
Population data lives in county reports, not a public name-search tool. The Sheriff's inmate information page gives the headline average. The county's criminal justice department publishes a jail population management page that explains the operational picture. Annual reports and the county's financial reports carry the year-by-year averages.
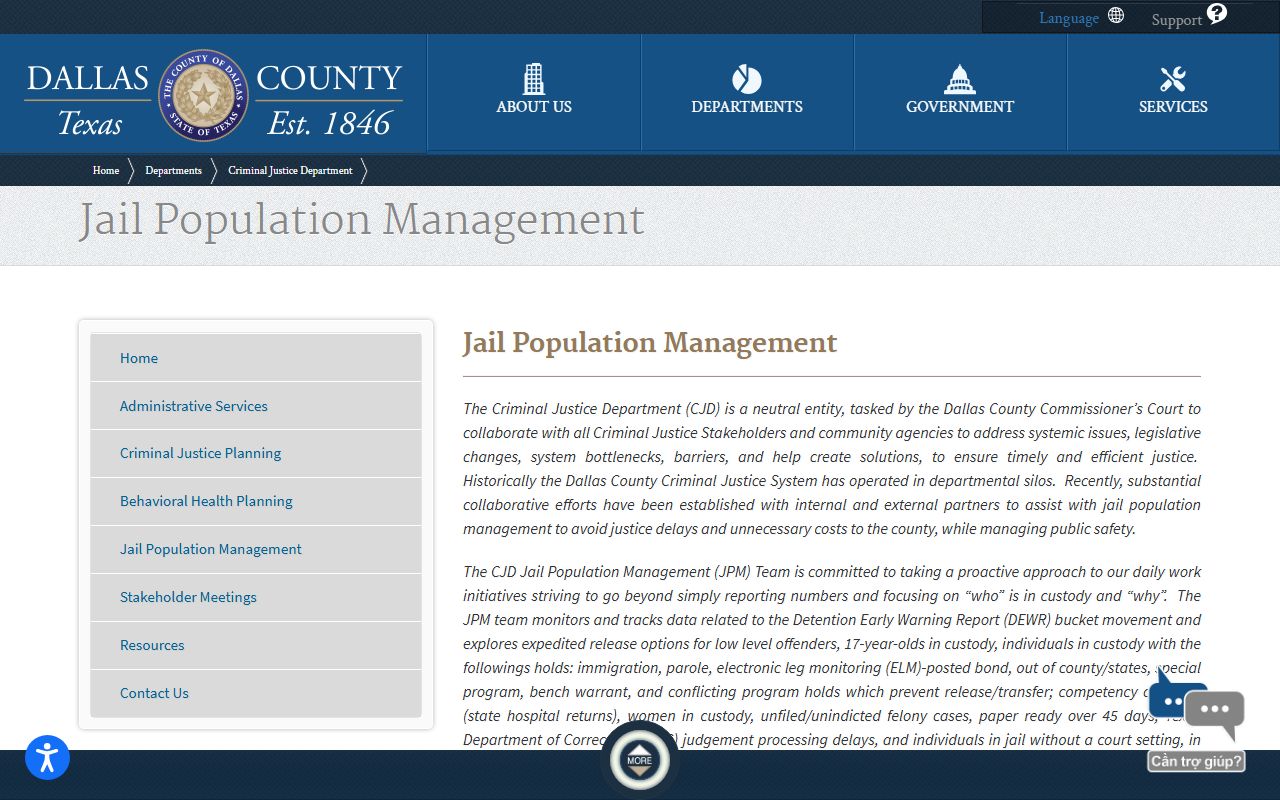
The jail population management page describes how the county tracks custody, holds, and release options. For an individual person, use the jail lookup on the Dallas County inmate records page instead.
Dallas County Jail Capacity Overview
The jail complex sits along Riverfront Boulevard and Commerce Street and is made up of several towers. The North Tower is the documented maximum-security building. Capacity for the South and West Towers was not published in the accessible county pages, so those rows are marked as not listed.
| Facility / Unit | Figure | Source Note |
|---|---|---|
| North Tower Jail | 3,292 maximum-security inmates | Facilities Management North Tower page |
| North Tower single cells | 188 | Facilities Management North Tower page |
| North Tower medical space | 3 floors | Facilities Management North Tower page |
| South Tower / Kays | Not listed | Facility described, capacity not published |
| West Tower | Not listed | Facility described, capacity not published |
The North Tower was built in 1993 and is maintained to Texas Commission on Jail Standards rules.
Average Daily Population in Dallas County
The Sheriff reports an average jail population over 6,000, with more than 2,000 employees, ranking the system as the seventh-largest jail in the United States. A single-day snapshot from a 2024 population packet listed 6,721 people in custody.
Volume is high across a year. The Sheriff's 2024 annual report counted 50,117 people released from the Dallas County jail in 2024. That release count reflects the constant churn of a large urban jail, where bookings and releases happen every day.
The county's criminal justice team manages this flow actively. It tracks expedited release options for low-level offenders, monitors how cases move through processing, and watches for bottlenecks that slow release. The factors below all push the daily count up or down:
- Immigration, parole, and out-of-county or out-of-state holds.
- Bench warrants and conflicting-program holds.
- Competency concerns and waits for a state hospital bed.
- Unfiled or unindicted felony cases.
- State cases paper-ready over 45 days and TDCJ transfer delays.
- People in custody without a court setting.
Because of these factors, the jail count is not just a function of arrests; it reflects how quickly cases move through the courts and the state system.
Demographic Breakdown
A detailed demographic breakdown by race, sex, and age was not published in the accessible county sources reviewed for this page. The county does track women in custody as a distinct management group, and the Sheriff's annual report is the best official source for fuller demographic detail.
For independent demographic and trend context, national research bodies like the Bureau of Justice Statistics and the Vera Institute of Justice publish jail data. Those figures are state and national, not Dallas-specific, so treat them as context rather than a county count. The Prison Policy Initiative also publishes Texas-level data that can frame the county picture. When a number is county-specific, this page cites a Dallas County source; when it is broader context, it points to these research bodies, so the two are never mixed.
Pretrial Versus Sentenced Population
Most large county jails hold a mix of people awaiting trial and people serving short sentences or waiting to transfer. A precise pretrial-to-sentenced split for Dallas County was not published in the accessible sources, so the table below frames the categories rather than assigning county percentages.
| Group | Who They Are | What Affects the Count |
|---|---|---|
| Pretrial | Held while a case is pending | Bond, court settings, indictment timing |
| Sentenced | Serving a county sentence | Sentence length and credit |
| Awaiting transfer | Sentenced to state prison | TDCJ judgment processing and transfer timing |
The county notes that paper-ready state cases over 45 days and TDCJ transfer delays both keep people in the county jail longer than the case alone would suggest.
Misdemeanor Versus Felony Population
The jail holds people on both misdemeanor and felony matters. Felonies run through the district courts, while Class A and Class B misdemeanors run through the eleven county criminal courts. The county criminal courts process about 32,500 cases a year, which feeds the misdemeanor side of the jail count.
An exact misdemeanor-to-felony split of the jail population was not published in the accessible sources. What the county does make clear is that unfiled or unindicted felony cases, competency holds, and people without a court setting all add to the count beyond simple arrest numbers.
Mental Health and Medical Population
A share of the jail population needs mental health or medical care. The North Tower includes three floors of medical space. The county's population team tracks competency concerns and waits for state hospital beds as factors that keep certain people in custody.
Dallas County leans on specialty courts and the Public Defender to move eligible people into treatment instead of jail. The Public Defender staffs most of these courts.
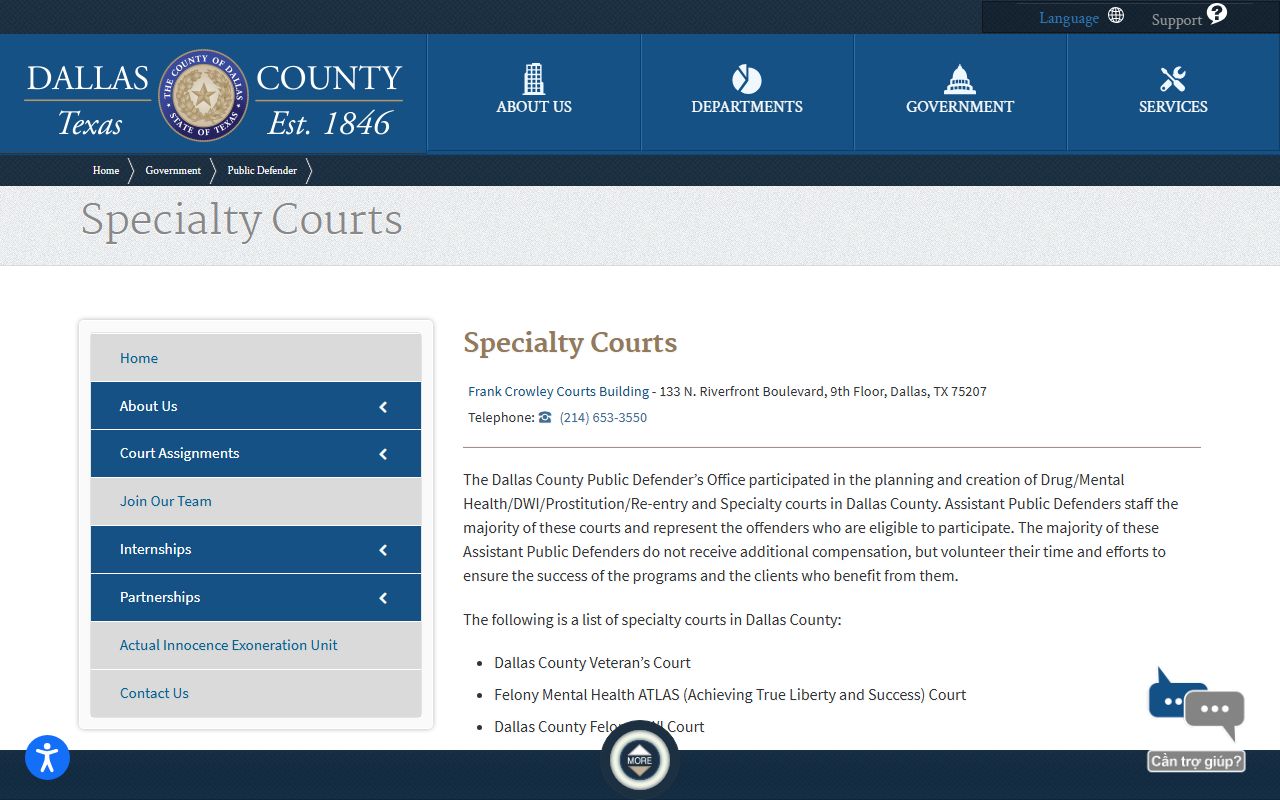
The Public Defender specialty courts include mental health, DWI, drug, and competency restoration programs. The office lists its division contacts too.
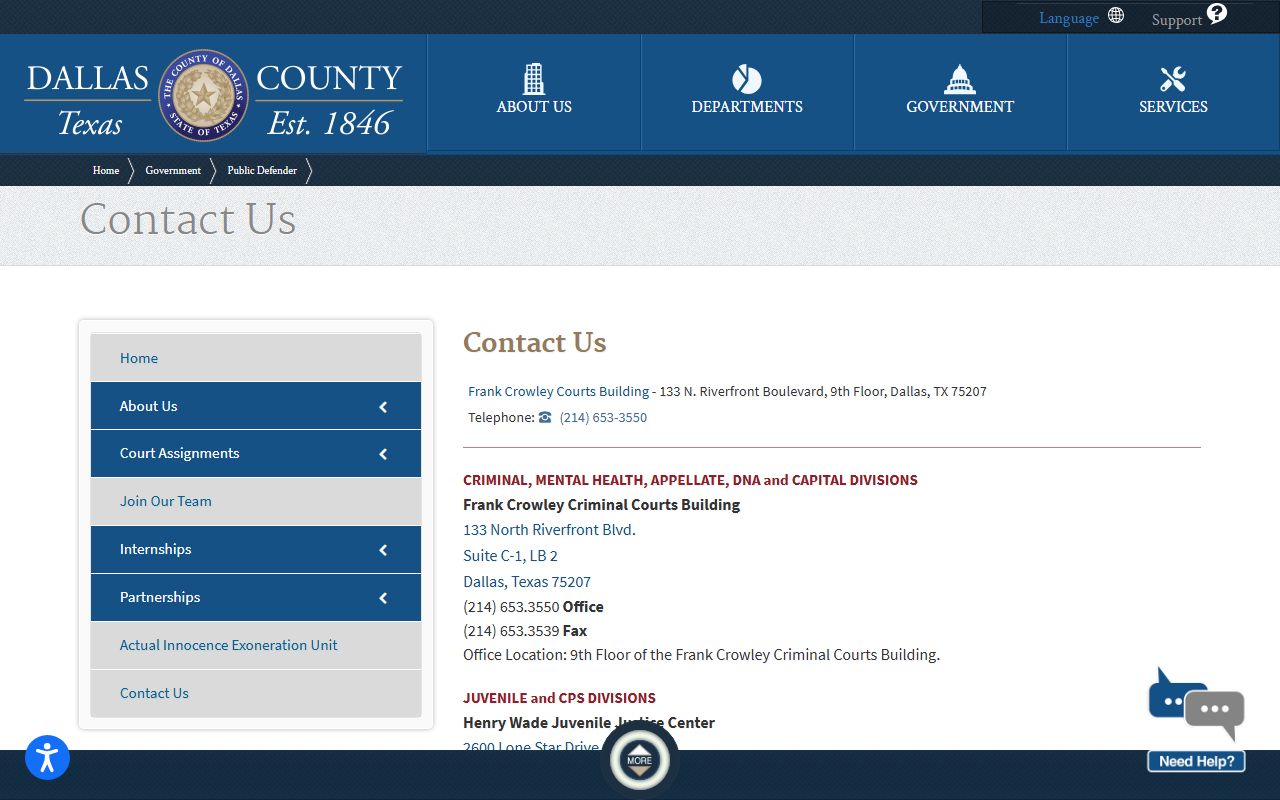
The Public Defender contact page lists the criminal, juvenile, and family division offices that support these diversion efforts.
National and State Context
To judge whether a jail count is high, compare it across custody levels and against research benchmarks. County jails, state prisons, and federal prisons each hold different groups and report through different systems. The comparison below sorts them out.
| Custody Level | Who Is Held | Data Source |
|---|---|---|
| County jail (Dallas) | Pretrial and short-sentence inmates | Sheriff reports and county financial report |
| State prison (Texas) | People serving felony prison terms | Texas Department of Criminal Justice |
| National benchmark | All U.S. jails for comparison | Bureau of Justice Statistics, Vera Institute |
Per-100,000 incarceration rates for county, state, and national comparison are published by the Bureau of Justice Statistics and the Vera Institute. Those rates are not county-issued, so confirm current figures from those sources before quoting them. A county jail count and a state prison count are not the same measure, since a jail holds mostly pretrial and short-term inmates while a prison holds people serving longer felony terms. Comparing the wrong two numbers can paint a misleading picture, so match the measure to the question you are asking.
Population Trends Over Time
Recent county figures point upward. Accessible county financial report values show daily averages rising through roughly 5,795, then 6,169, then 6,407 in the most recent listed years, with a September 2024 single-day snapshot of 6,721. Exact year labels should be confirmed against the county financial report before they are quoted as a fixed series.
Trends are shaped by more than crime. Court settings, indictment timing, state hospital bed waits, TDCJ transfer timing, bond posting, and specialty-program holds all move the count. That is why two months with similar arrest totals can still show different jail populations. A rising daily average can reflect slower case processing or transfer delays just as much as more arrests, which is why the county tracks the bottlenecks rather than the headline number alone.
Searching for Dallas County Inmate Records by Name
This page covers population data, not individual lookups. To find a specific person, use the jail lookup on the Dallas County inmate records page, which searches by name, book-in number, or case number. The county wanted search is a separate tool for warrants and unpaid balances.
The Dallas County Wanted search looks up people with warrants and scofflaw blocks by name, citation, case, or plate. Its FAQ explains how the listings work.
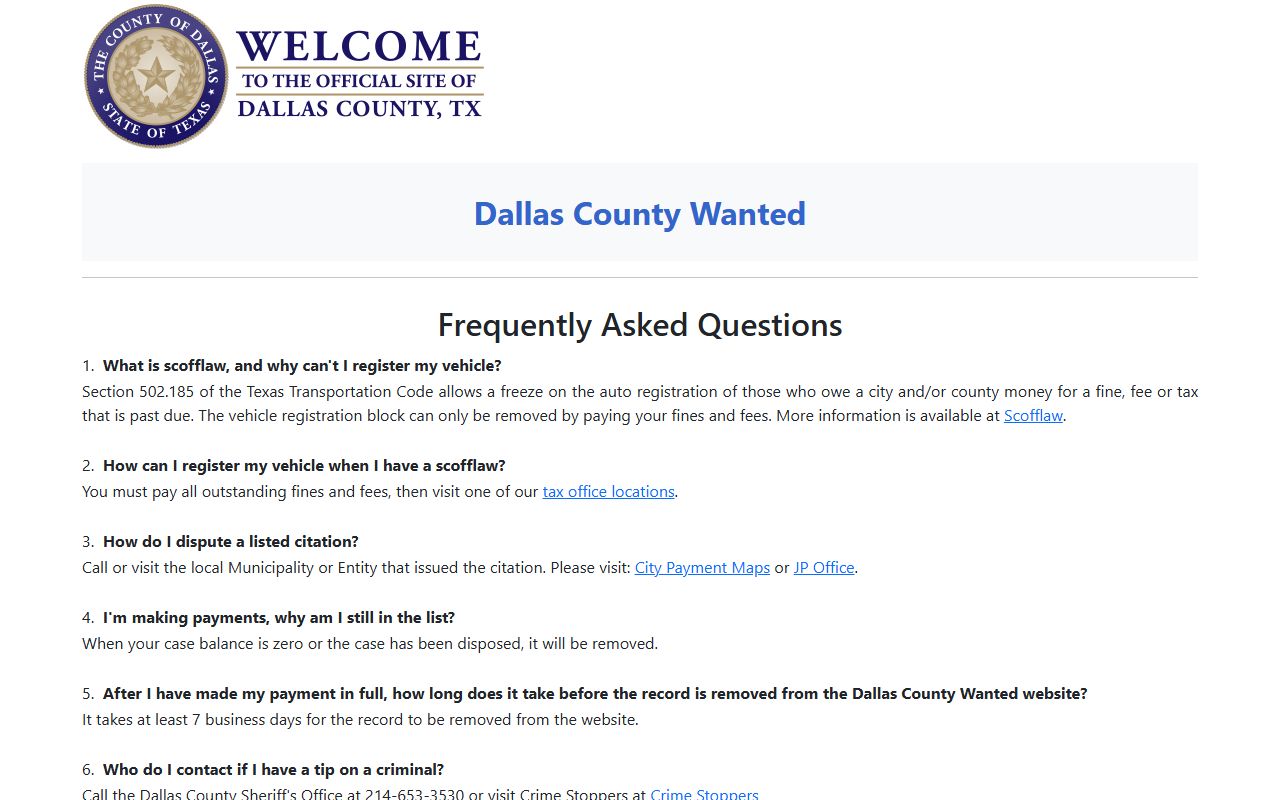
The Wanted FAQ covers scofflaw, citation disputes, and removal timing. A public Top 50 list shows the result columns.
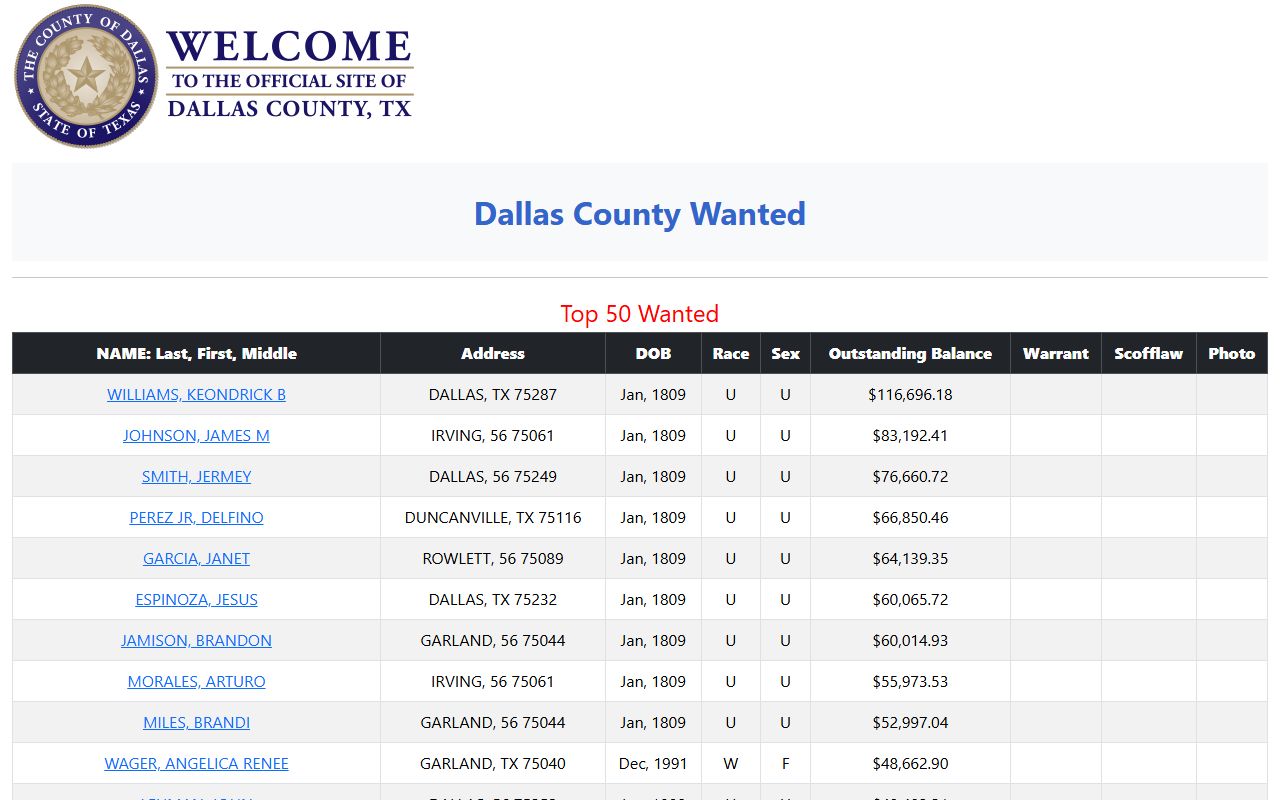
The Wanted Top 50 list shows name, balance, warrant, and scofflaw columns. For warrant detail, see the warrant records page.
Where the Dallas County Jail Population Data Comes From
Several official sources feed these numbers. The Sheriff's inmate information page gives the headline average. The Sheriff's annual report adds release counts and operational detail. The county's financial report carries the year-by-year daily averages. The criminal justice department's jail population page explains the management factors.
These sources update on different schedules. The annual report and financial report come out once a year, while the population management page reflects ongoing operations. The Texas Commission on Jail Standards also inspects the jail, and in January 2024 the county reported that the jail passed its state inspection. For a live custody check on one person, the jail lookup is the right tool, since reports lag real-time custody.
Note: Population figures are snapshots from county reports, so confirm the latest numbers in the current Sheriff annual report and county financial report before citing them.